Revenue Forecast
Table of Contents
Seasonality Overview
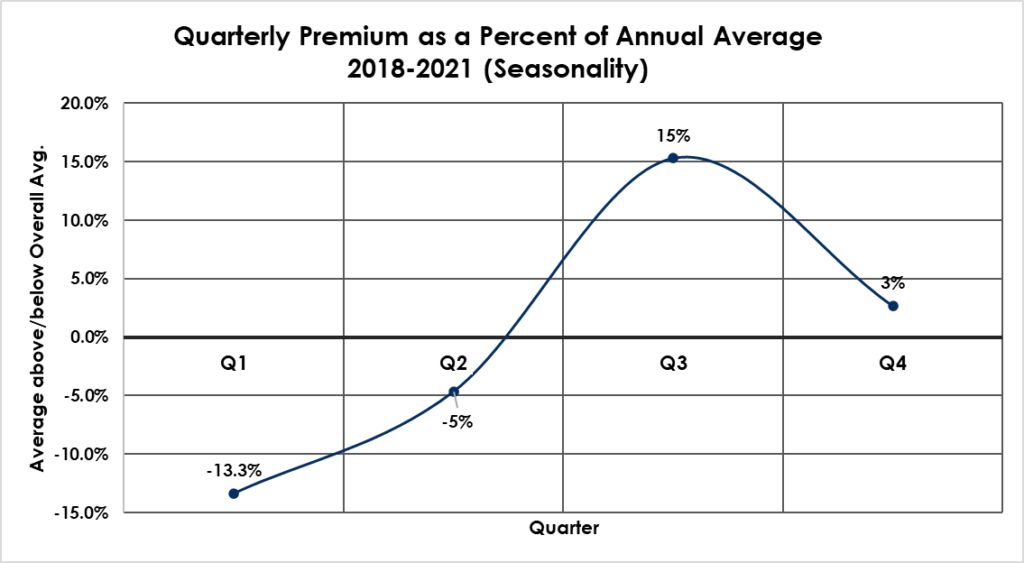
The graph above shows how the average premium is affected by quarterly differences. This is referred to as “seasonality” since it represents a recurring pattern over a similar period. For example, in Q3, the highest premium quarter, forecast premium is about 15% higher than the annual average.
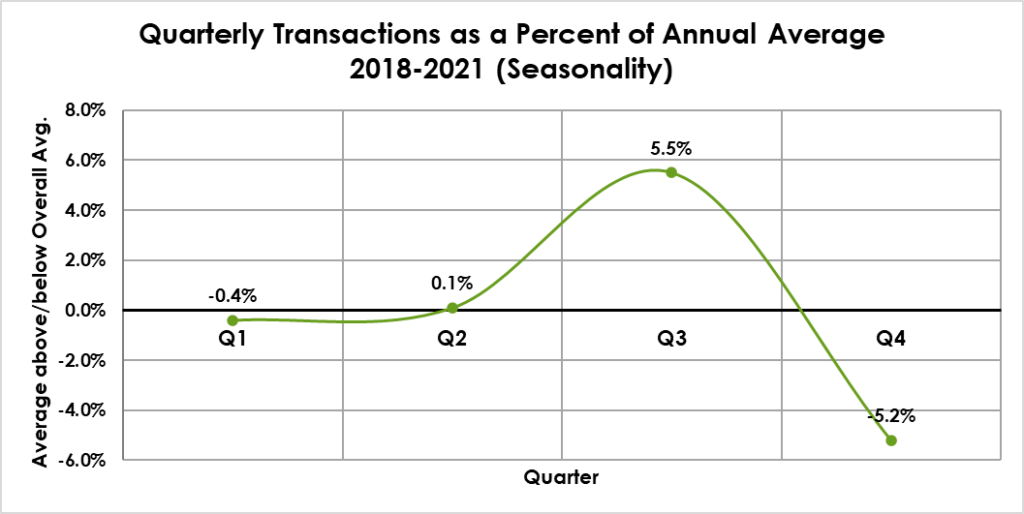
The graph above shows how average transaction counts are affected by quarterly differences. In Q4 the lowest transaction quarter, expected transaction counts are about 5.2% lower than the annual average.
How This Helps Forecasting
By observing actual results for early quarters, we can apply these seasonality percentages to the actual averages we observe and use that to forecast the entire year.
Effects of Late Filings on SLA Revenue
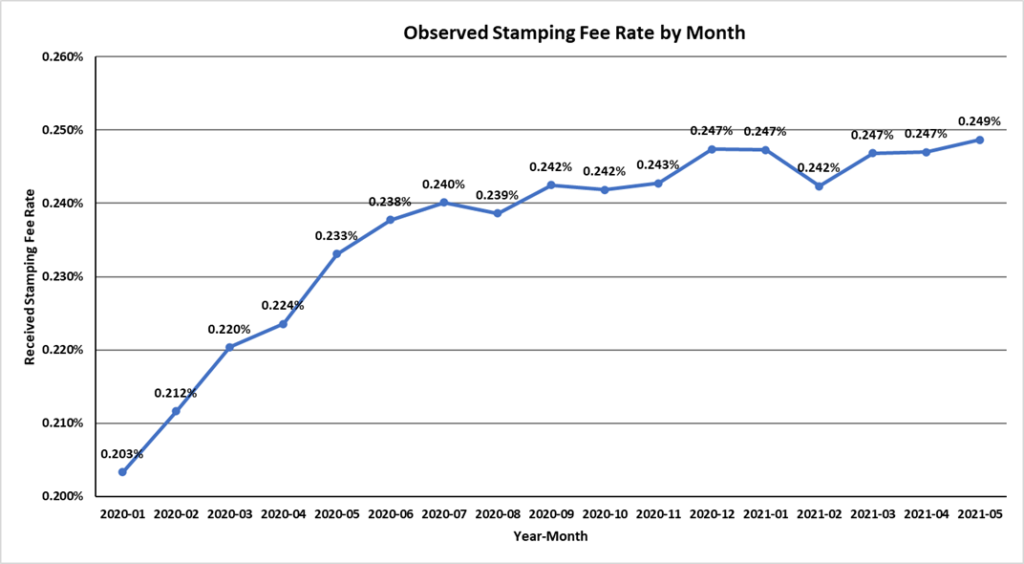
The graph above shows the effective stamping fee rate by month since the stamping fee was raised in January 2020. In all past stamping fee change years, it took roughly six months into the next period to see the new stamping fee fully take effect.
As of May 31, 2021, essentially all transactions are now received under the .25% rate.
Seasonally-Based Forecasts for 2021
Premium Forecast
| Premium | Stamping Fees | Percent Change From Prior Year | |
| 2021 Adjusted Revenue | $11,686,388,618 | $29,215,972 | 10.0% |
This chart shows the forecasted or estimated premium for fiscal year 2021. This represents approximately a 10% increase over 2020 ($10.624B submitted premium)
Transaction Count Forecast
| Model 1: Seasonally Adjusted Submitted Transactions and Percent Change from Prior Year | ||
| 2021 Adjusted Transactions: | 805,829 | 6.0% |
This chart shows the forecasted or estimated total number of transactions received in fiscal year 2021. This represents approximately a 6% increase over 2020 total received transactions (760,565 submitted transactions).
Conclusion
The market appears to be gradually slowing down both in premium and transactions. In early Q1’21, the models were showing an $11.9B market (+12.1%) and around 810,000 transactions (+7%). However, the average premium per transaction has increased by nearly 3% in 2021 as compared to 2020, indicating that the market is still hardening. Last year, extended forecast models showed the market plateauing near the latter half of 2022, and this slow down appears to be starting already.